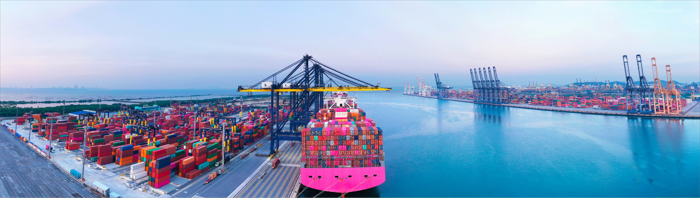
As Black Friday approaches, the Port of Long Beach reported steady trade activity through October, keeping pace with last year's strong performance. Retailers continued to move goods early to offset tariff-related costs and ensure well-stocked inventories ahead of the holiday season.
During a virtual news conference, Port CEO Mario Cordero and COO Noel Hacegaba said cargo has been moving efficiently despite economic and trade policy uncertainty. "Consumers have not yet felt major tariff impacts, but that may change as we approach 2026," Cordero noted. "We expect more costs to be passed along to consumers in the coming months."
Hacegaba added that even amid challenges like the ongoing government shutdown, the Port's operations and national supply chains remain stable. "We're working closely with partners to anticipate and mitigate issues before they arise," he said.
In October, dockworkers and terminal operators handled 839,671 TEUs, a 14.9% drop from October 2024, the Port's strongest month on record. Imports declined 17.6% to 401,915 TEUs, exports fell 11.5% to 99,817 TEUs, and empty containers decreased 12.6% to 337,940 TEUS.
Despite the monthly decline, year-to-date volumes remain positive, with 8.23 million TEUs moved from January through October, up 4.1% compared to the same period last year.
Harbor Commission President Frank Colonna praised the workforce and terminal operators for maintaining reliability. "We're ensuring shelves are stocked and shoppers have access to holiday goods while continuing to build for a sustainable future," he said.


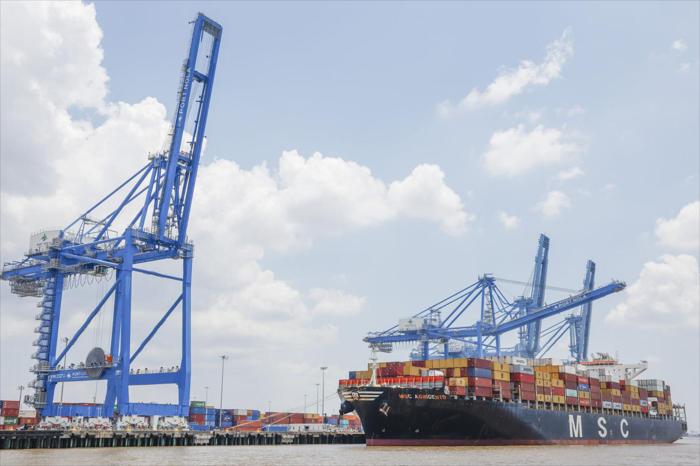
MSC's Terminal Investment Limited (TIL) has received the final four of nine new ship-to-shore gantry cranes destined for Terminaux de Normandie MSC (TNMSC) and Terminal Porte Océane (TPO) in Le Havre.
With an outreach of 72 metres (26 containers), the cranes form part of a USD 700 million investment programme aimed at modernising and expanding the port's handling capacity.
The new equipment will enable Le Havre to accommodate the world's largest container ships, significantly improving operational efficiency and turnaround times.
According to DynaLiners, this milestone marks the completion of one of the largest port equipment upgrades ever undertaken in Northern Europe, reinforcing Le Havre's position as a key hub in MSC's global network.
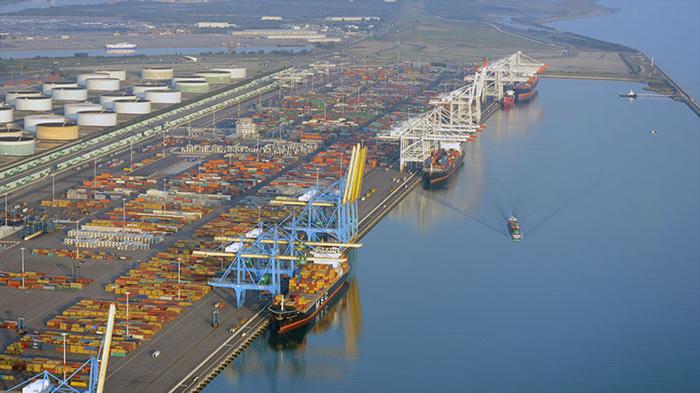

The Port of Oakland has announced two strategic accomplishments advancing its objective to become the United States' cleanest and most environmentally sustainable port.
In 2024, a record 86% of electricity supplied to Port tenants and facilities originated from renewable and zero-carbon sources; additionally, the Port finalized a long-term energy storage services agreement designed to strengthen energy supply reliability, optimize solar power utilization, and accelerate complete clean energy transition.
The Port's renewable power metrics are documented in the annual Power Source Disclosure Report and Power Content Label, verified and submitted to the California Energy Commission.
During 2024, 62% of the Port's energy supply derived from renewable sources including geothermal, solar, and biomass energy, with an additional 24% sourced from large-scale hydroelectric power generation.
Contextually, the Port nearly doubled California's Renewable Portfolio Standard soft target of 44% renewable energy requirements.
Andre Basler, Utilities Director at the Port of Oakland stated that despite market challenges, they maintain focus on sourcing sustainable power that reduces emissions and supports California's energy objectives.
The Port has additionally executed an agreement with Trolley Pass Project LLC to secure long-term energy storage services that will stabilize energy costs, deliver environmental benefits, and support Strategic Plan objectives for zero emissions transition and infrastructure resilience development.
The agreement, approved by the Port's Board of Commissioners, establishes Port participation in a battery energy storage system facility with up to 400-megawatt capacity located in San Bernardino County.
The Port will receive 4 megawatts of storage capacity under a 20-year Energy Storage Service Agreement, at a total cost not exceeding US$13.3 million.
Through participation in this in-state initiative, the Port will reduce reliance on market power purchases, fulfill Resource Adequacy requirements, and enhance renewable energy investment value.
The agreement supports California's Senate Bill 100 objectives, mandating 100% clean electricity by 2045.


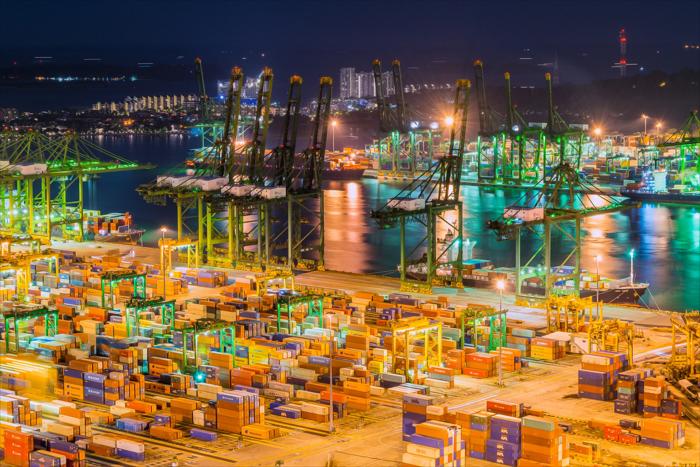
The Ministry of Transport of the Republic of Singapore and the Ministry of Oceans and Fisheries of the Republic of Korea have formalized a Memorandum of Understanding establishing the Singapore-ROK Green and Digital Shipping Corridor.
The agreement was executed by Singapore's Acting Minister for Transport Jeffrey Siow and ROK's Minister of Oceans and Fisheries Chun Jae Soo.
The MOU exchange occurred on 2 November 2025, conducted by Singapore's Senior Minister of State for Transport Murali Pillai and Minister Chun Jae Soo, witnessed by Singapore's Prime Minister Lawrence Wong and ROK's President Lee Jae Myung.
The MOU framework authorizes the Maritime and Port Authority of Singapore and the Ministry of Oceans and Fisheries to explore and implement initiatives supporting the maritime sector's transition toward zero or near-zero greenhouse gas emission fuels.
Priority areas encompass bunkering infrastructure development, technical standards alignment, technical knowledge exchange, collaborative trials with industry and research partners, and joint maritime stakeholder training programs.
The agreement additionally targets accelerated digitalization to optimize information exchange and operational efficiency.
This bilateral collaboration reinforces Singapore's and the ROK's commitment to accelerating clean maritime technology growth and deployment while enhancing global supply chain efficiency and sustainability.
Jeffrey Siow, Acting Minister for Transport, emphasized that this partnership reflects a mutual commitment to developing a sustainable, future-oriented maritime sector.
Chun Jae Soo, Minister of Oceans and Fisheries, stated that this cooperation will accelerate green fuel adoption and digital solution implementation, contributing to sustainable global maritime sector development."
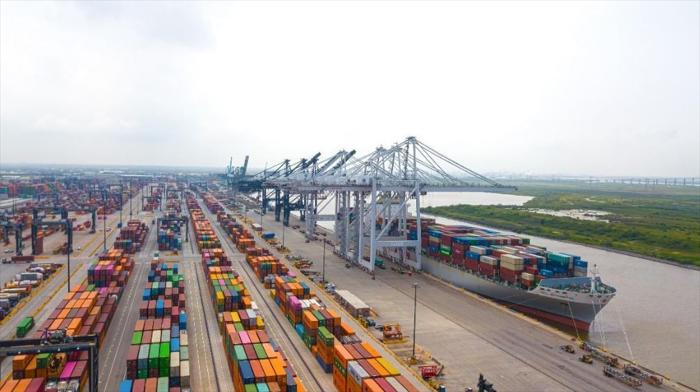
Port Houston crossed the three million TEU mark in September, reaching 3,270,595 TEUS year-to-date, the fastest pace in Port Houston's history.
Total container volumes are up 5% year-to-date ompared to last year.
Charlie Jenkins, CEO of Port Houston, said that this is the earliest they've ever reached that mark.
For the month of September, Port Houston handled 337,659 TEUs, a 2% increase from the same month in 2024.
Loaded exports continued rising, up 13% for the month and 7% year-to-date, driven by Houston's strong resin and manufactured goods. Loaded import volumes softened slightly for the month, though they remain up 3% year-to-date.
While Port Houston anticipates a more measured pace at its container terminals through the fourth quarter, overall performance remains consistent and positioned for a solid year-end finish.
Steel imports declined 56% in September but are nearly flat year-to-date. General cargo is up 1% year-to-date, and total tonnage across Port Houston's public terminals reached 41,593,972 short tons through September, up 5% compared to the same time last year.
In September, Port Houston representatives participated in the PromPerú Ports & Trade Seminar to highlight how Houston's infrastructure supports Peruvian imports, particularly the growing demand for fresh fruit and perishables.
In fact, reefer imports increased 19% year-to-date through August, much of it driven by trade with Latin America.
Although refrigerated cargo is a growing segment, Houston's largest cargo segment remains anchored in energy-related exports driven by the region's petrochemical sector.
Hamburg Commercial Bank AG (HCOB) is acting as lead arranger in a €160 million financing package for Inland Terminals Group (ITG), together with a consortium of international banks. HCOB also served as facility and security agent for the transaction.
IT is the largest inland container terminal operator in the Benelux region, providing comprehensive logistics services through its network of 17 terminals along key waterways connected to the ports of Rotterdam and Antwerp. The company was formed in 2021 by infrastructure investor Infracapital following the acquisition of BCTN's inland terminal operations.
Hans Lötzer, Head of Project Finance at HCOB, said: "We are delighted to support ITG with this financing and to further expand our existing business relationship with Infracapital. This transaction underscores our strength in delivering tailored and one stop solutions for our customers."
César Bravo, Project Finance Director at HCOB, added: "We congratulate the ITG and Infracapital teams for this successful financing and look forward to continue supporting their future growth."
Lee Hamano-Crossingham, Investment Director at Infracapital, commented: "The refinancing of IT is a major milestone for our business, with strong lender support reflecting the market leading platform that we have developed and its highly resilient infrastructure characteristics. We are pleased to have partnered with HCOB on this deal and to continue the close cooperation between Infracapital and HCOB."
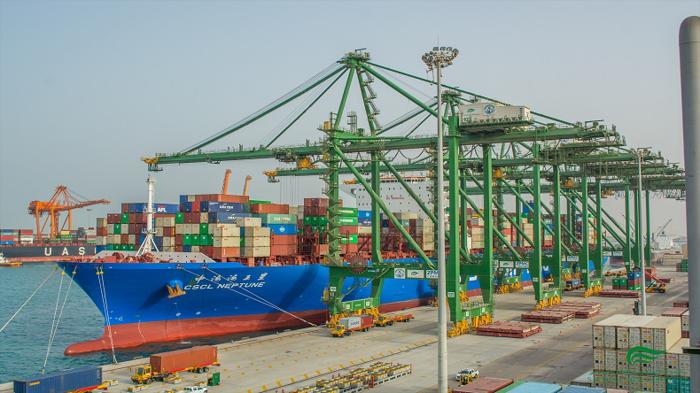
SGP Container Terminals, a subsidiary of Saudi Global Ports Group has achieved a significant milestone by surpassing 15 million TEUs in cumulative container throughput handled at King Abdulaziz Port Dammam since commencing operations in 2015.
This milestone was achieved through close collaboration with the Saudi Ports Authority, Zakat, Tax and Customs Authority, global shipping lines, and various long-term partners.
SGP operates the largest container terminal on the Eastern Coast of Saudi Arabia at King Abdulaziz Port Dammam and has played a central role in connecting the Kingdom's industries to international markets.
Supported by PSA International's global expertise in container terminals, the volumes handled at SGP Container Terminals have continued growing year on year to achieve a high of 3.2 million TEUs in 2024.
This achievement further reinforces SP's long-term growth trajectory, following shortly after the successful award and integration of Multipurpose Terminals along the Eastern Coast in July 2025.
Collectively, these developments demonstrate SP's continued commitment to transforming the ports and logistics ecosystem in Saudi Arabia, driven by sustained investments in technology, operational excellence, and workforce development.
Daniel Phay, Chief Executive Officer of SGP Container Terminals, added that surpassing 15 million TEUs is a proud achievement, reflecting years of unwavering commitment and dedication as they align with purpose to deliver reliable and efficient service for the customers.
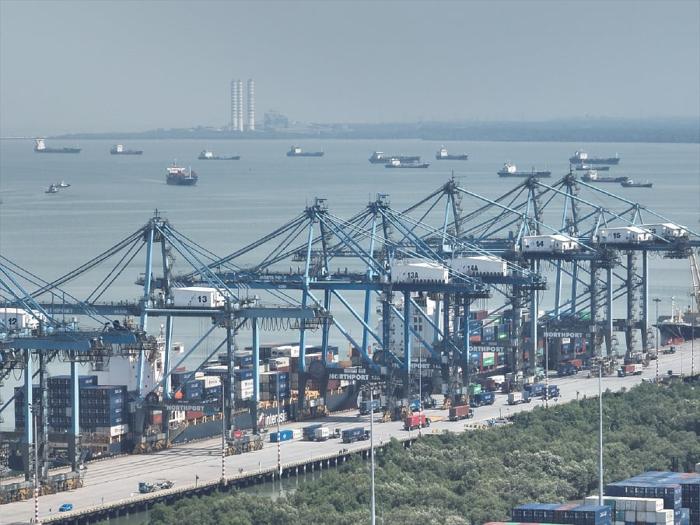
NorthPort, the Philippines' lead gateway for domestic cargo operated by ICTSI, takes a significant step toward more sustainable operations with the conversion of its rubber-tired gantry cranes into hybrids.
The conversion enables the RTGs to operate more efficiently while reducing the terminal's carbon footprint.
Six RTGs were converted into hybrids by replacing their diesel generator sets with smaller generators paired with high-capacity, liquid-cooled battery systems.
These now run primarily on batteries, which are recharged by the smaller generator sets, resulting in reduced diesel consumption and maintenance requirements.
The initial batch of hybrids is now fully operational, achieving a 49% reduction in carbon emissions and diesel consumption. This lowers the terminal's average annual carbon emissions by half from 2,186 tons to an estimated 1,109 tons.
Moreover, NorthPort is expanding its hybrid RTG fleet with the acquisition of four new Mitsui hybrid units, scheduled for delivery in the fourth quarter of 2026.
The Port of New Orleans announced that the United States Department of Commerce has approved its application to expand Port NOLA's Federal Trade Zone service area to include St. Tammany Parish. FTZ No. 2 already covers Orleans, Jefferson, and St. Bernard Parishes.
This expansion positions the Port and the broader Southeast Louisiana business community to attract new investment, support regional economic development, and create jobs.
Beth Branch, Port NOLA President and CEO, said that by expanding our Federal Trade Zone into St. Tammany Parish, they're offering businesses another powerful tool to strengthen their competitiveness, increase trade opportunities, and ultimately generate new jobs across the region.
A Federal Trade Zone is a secure area under US Customs and Border Protection supervision that allows businesses to defer, reduce, or eliminate duties on imported goods. FTZ designation gives companies greater flexibility in supply chain management and encourages international trade.
Through a strategic partnership with the St. Tammany Economic Development Corporation, Port NOLA is supporting expanded growth opportunities on the Northshore, as well as increasing revenue across both the region and the state.
Russell Richardson, President and CEO of St. Tammany EDC, commented that this designation not only strengthens our connection to global markets but also reinforces St. Tammany's role as a critical hub for commerce and logistics in Southeast Louisiana.
Expanding FTZ No. 2 into St. Tammany will help move more cargo through the Port of New Orleans while also enhancing Louisiana's role in global commerce.
Incheon Port Authority sees India and Indonesia as the new China, tapping into countries that are two of the largest emerging markets for container shipments.
And it has launched the South Korean port's first direct container shipping link with India - the Far East-India Express (FIE).
Incheon port officials said FIE was expected to become a key transport link for raw materials and finished products from major manufacturing plants in East India and the Seoul metropolitan area.
Containerised exports from South Korea to India, were previously handled only at Busan and Gwangyang ports. Incheon Port Authority
president Lee Kyung-Kyu said: "The opening of this Far East-India route will mark a new turning point in Incheon port's expansion of its logistics network with major ports in South Asia. We will strengthen our cooperation with South Asia to support exporters and importers in the Seoul area."
The authority said it had recently been pursuing a strategy focusing on the "Next China" region to respond to the changing global shipping environment and the diversification of China-centric supply chains.
With US president Donald Trump hitting back at the concentration of manufacturing in China with tariffs, factories have been shifting to Southeast Asia.
Specifically, Incheon Port Authority has targeted the Indian and Indonesian markets, and has been creating new routes through visiting shippers, and offering incentives in strategic regions.